Furniture Decommission Decision Model
Part 2 of 3 - Cost/Benefit Analysis
As seen in Part 1, each of the disposition options has two or more associated costs. In this section, we look at two sample analyses calculated with industry standard costs and revenue. Project management costs are roughly equivalent for each option and will not be considered in this model.
Note that these examples are intended to portray relative costs in specific scenarios. All projects are different and actual cost estimates will vary based on numerous factors.
Example 1 - Corporate Office Furniture
Scenario
In this example, corporate office furniture has been decommissioned. Facilities management is considering all of the options. The inventory consists of a typical office mix of tables, chairs, cabinets, and common area furniture. The inventory will fill one tightly packed 53’ trailer.
Capacity Equivalencies:
1 FRS trailer = 3 22′ straight trucks = 4 30 yard dumpsters = 2 storage trailers
Inventory:
Total weight = 10,000 pounds
Piececount = 250 pieces
1. Disposal Option

The entire inventory goes to the landfill. 30 yard roll-off waste containers are brought to the site and loaded by movers.
Crew on-site = 6 crew members
Total load time = 4 hours
2. Recycling Option

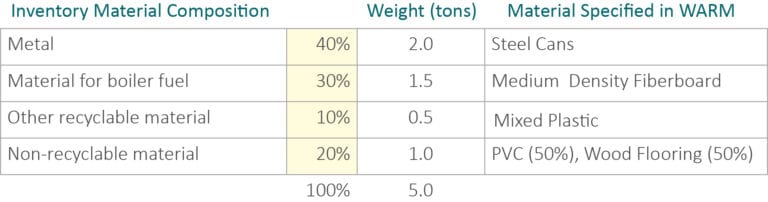
The recycling option considers the case where all recyclable materials in the inventory are disassembled and transported to a recycling center by movers. The remainder is taken to the landfill. Income will be realized from the sale of scrap metal. Other materials, such as composite table and desk tops and certain plastics, can be recycled as boiler fuel or other raw material for a fee.
Metal (for scrap) = 40% Other recyclable = 40% Non-recyclable = 20%
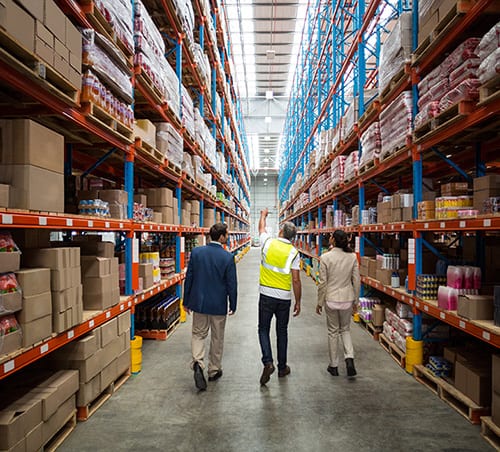
3. Storage Option

The storage option depicts the case where there is a possibility that the furniture may be redeployed or resold in the near future. In this case, two storage trailers are brought to the site, loaded, and then delivered to a yard to await their fate. The cost estimate does not include costs to transport and unload the trailers at their final destinations.
Crew on-site = 6 crew members
Total load time = 3 hours
Anticipated time in storage = 2 months
4. Liquidation Option
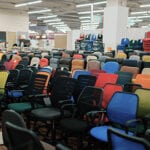
The only income producing option (with the exception of scrap metal income), liquidation is rarely an option for the entire inventory. This model assumes that a certain percentage of the inventory can be sold and that the remainder is recycled as per the recycling option described above.
Crew on-site = 6 crew members
Total load time = 3 hours
Percent of inventory that can be liquidated = 10%
5. Reuse Option

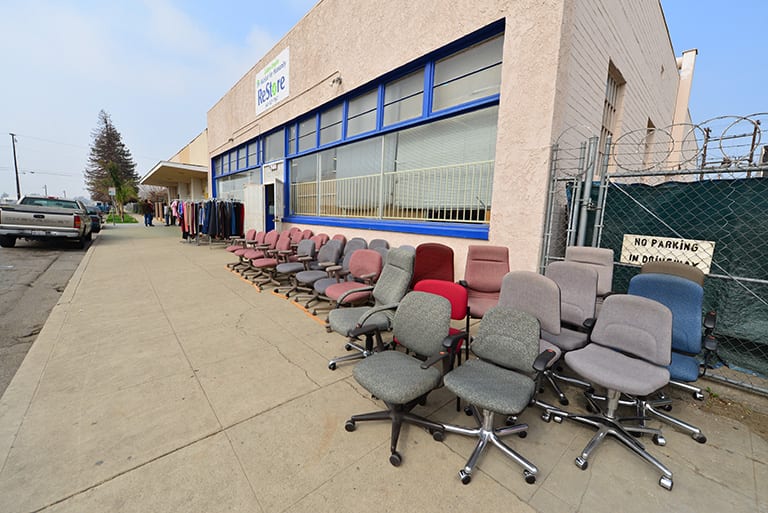
The reuse option assumes that the entire inventory is donated to a non-profit organization and can be loaded onto a single 53’ tractor trailer.
Crew on-site = 6 crew members
Total load time = 4 hours
Cost Calculations
In order to understand the magnitude of the various cost factors, expense and income is categorized as follows:
– Containers – donation container, roll-off waste containers, or monthly fees for storage containers
– Site Labor – loading and disassembly (where applicable)
– Transport, fees and unloading (where applicable), – recycling/disposal option, storage option
– Income from resale (liquidation) and scrap metal
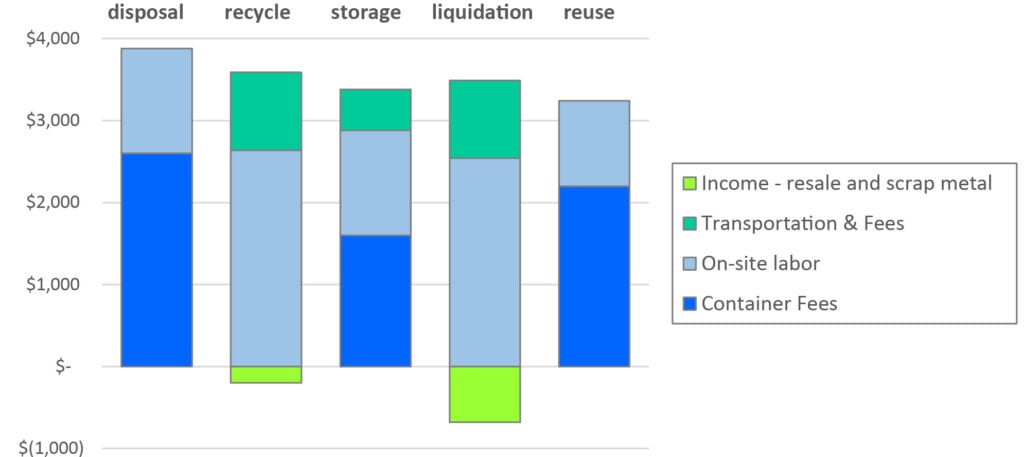
The graph below shows each cost element for each option. Reuse and disposal (via rolloff containers) are the least complicated options as they both only require container delivery and loading labor.
Cost Factors
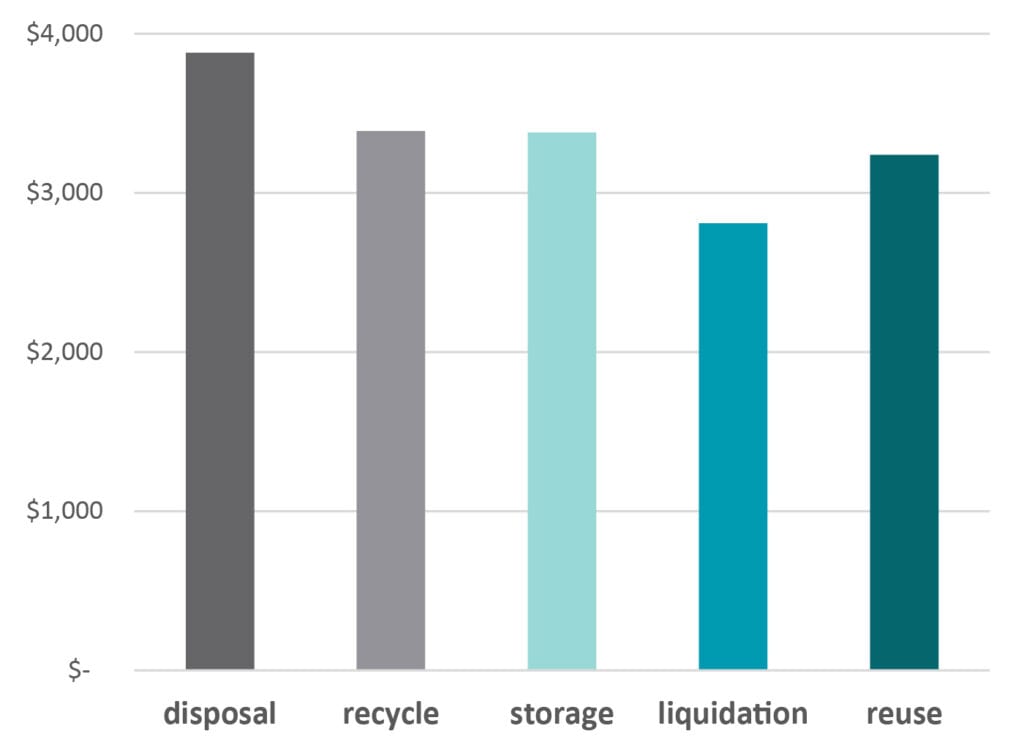
The total cost for each option is the sum of its components. As seen below, liquidation is the lowest cost option and disposal is the highest cost. Reuse has the second lowest cost, followed closely by recycling and storage. We can conclude that, under the assumptions of this example, all of the options are relatively close in cost. These options can be differentiated by their contribution to social responsibility, as well as the risks inherent to a project (covered in Part 3) that can significantly change the costs.
Total Costs
Example 2 - K-12 Classroom Furniture
Scenario
In this example, school furniture is being replaced. Facilities management is considering all of the options except liquidation (no U.S. market for classroom furniture) and storage (no future need for furniture in the school district). The inventory consists of student desks, chairs, and activity tables. The inventory will fill one tightly packed 40’ international shipping container.
Capacity Equivalencies:
1 FRS container = 3 22′ straight trucks = 3 30 yard dumpsters
Inventory:
Total weight = 10,000 pounds
Piececount = 320 pieces
All of the other assumptions given in Example 1 apply to Example 2.
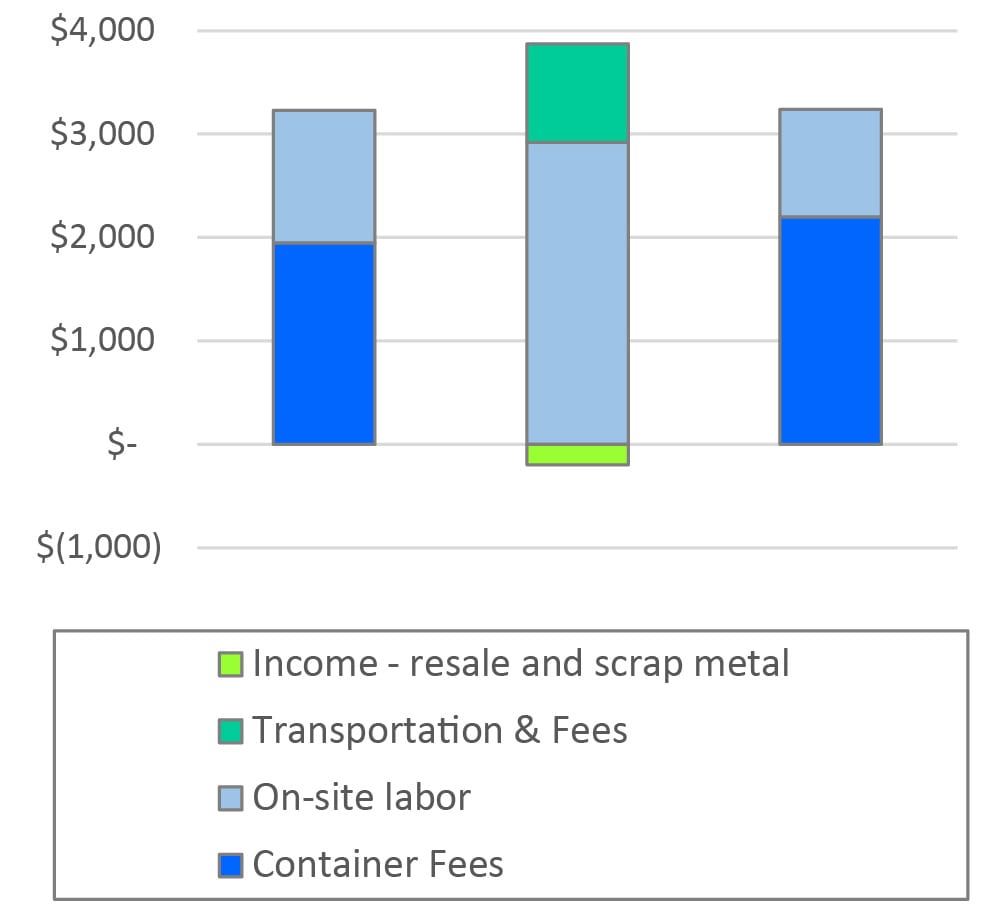
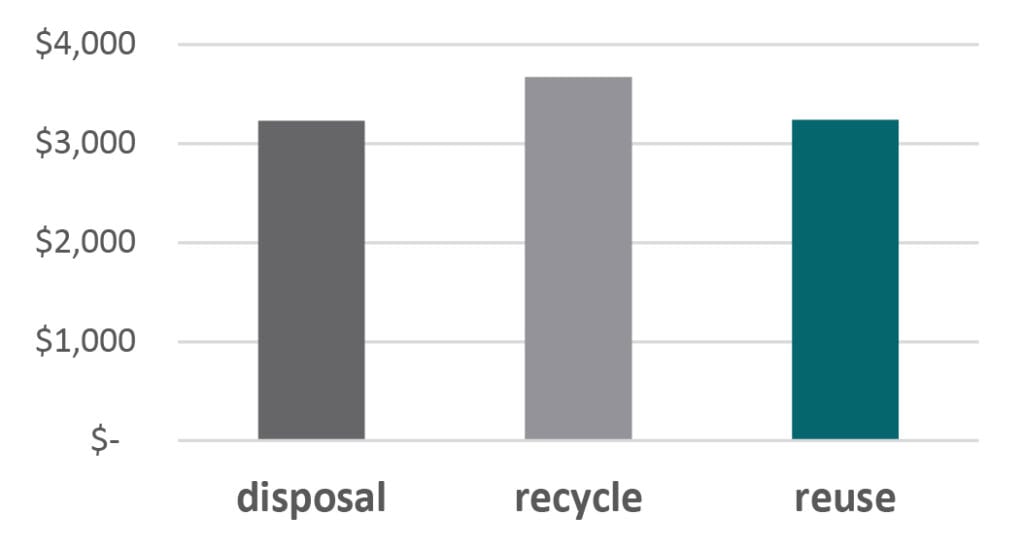
Cost Calculations
The results indicate that reuse and disposal are approximately equal in cost. Recycling costs are higher, primarily due to the additional labor required. As in Example 1, a good decision on the disposition of these items should consider cost, as well as risk factors and social responsibility contributions. Schools and their communities do not like to see usable furnishings go to the landfill. By choosing reuse, school districts can minimize cost and risk, while maximizing environmental conservation and helping communities in need.
Social Responsibility Analysis
Environmental Impact
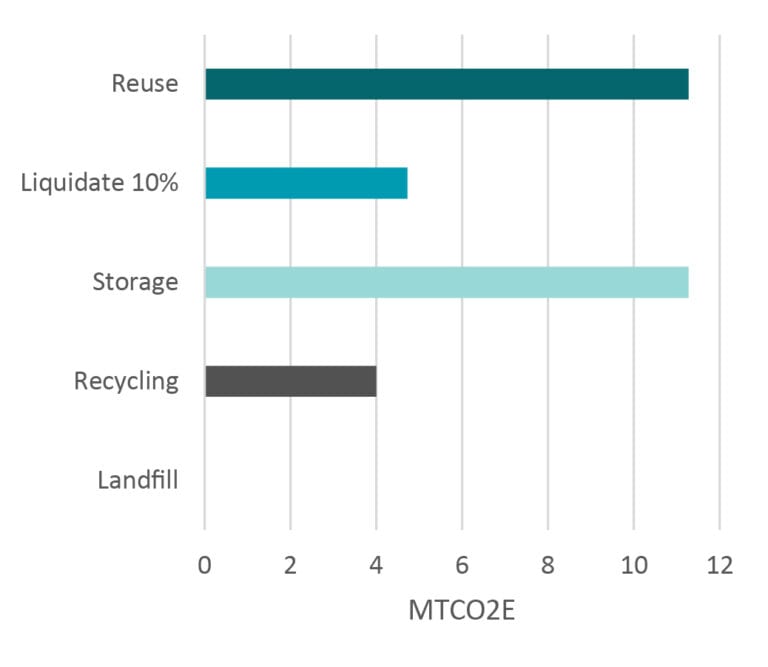
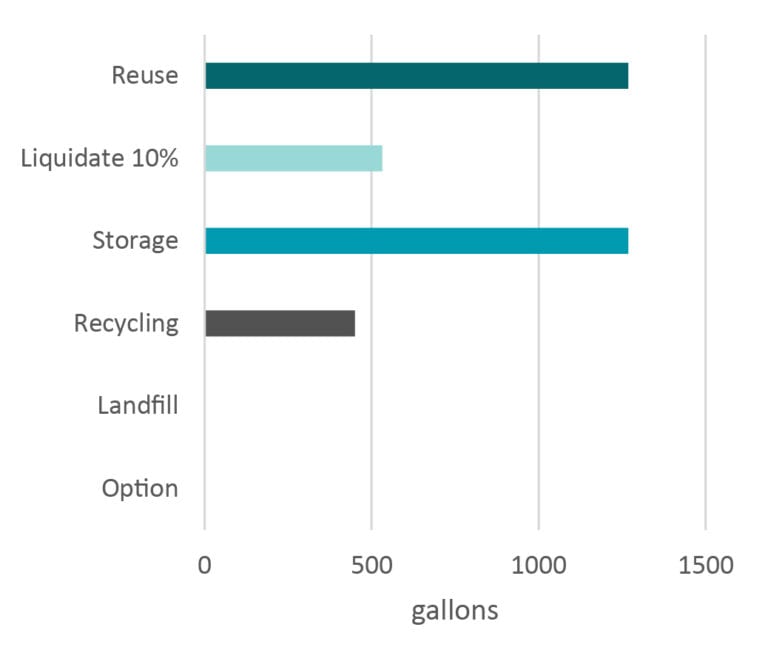
A rough assessment of greenhouse gas emissions can be determined by using the Waste Reduction Model Tool from the U.S. EPA. This tool calculates metric tons of carbon dioxide offset equivalent (MCO2E) for a baseline and alternative scenario.and the equivalency in gasoline conservation. The results presented here are based on the material composition of the inventory. These do not correlate exactly to the material choices available in the tool. However, the results will give an idea of the magnitude of difference among the various scenarios.
The calculations are based on national averages for landfill type and gas recovery. Note that the results do not include emissions from transportation to various destinations (warehouse, charity, etc.). The baseline scenario is the worst case for emissions- landfill. The results are the same for both examples:
Greenhouse Gas Emissions Offset
Gallons of Gasoline Conserved
Community Benefit
Reuse through donation is the only disposition option that provides a direct benefit to disadvantaged communities throughout the world. Furniture is sent to charities and non-profit organizations who deploy it to schools, orphanages, community centers, healthcare groups, and thrift stores with humanitarian missions.